
I love designing icons and infographics. It gives me the opportunity to distill complicated ideas into simple visuals. It also gives me the opportunity to draw, which I love to do. Earlier this year I was asked by the Design Director at SCIEX, Ann Asche, if I would be interested in designing their most recent infographic for their OneOmics software. Originally another designer had started the design, but the team wasn't happy with the results, so they came to me for help.

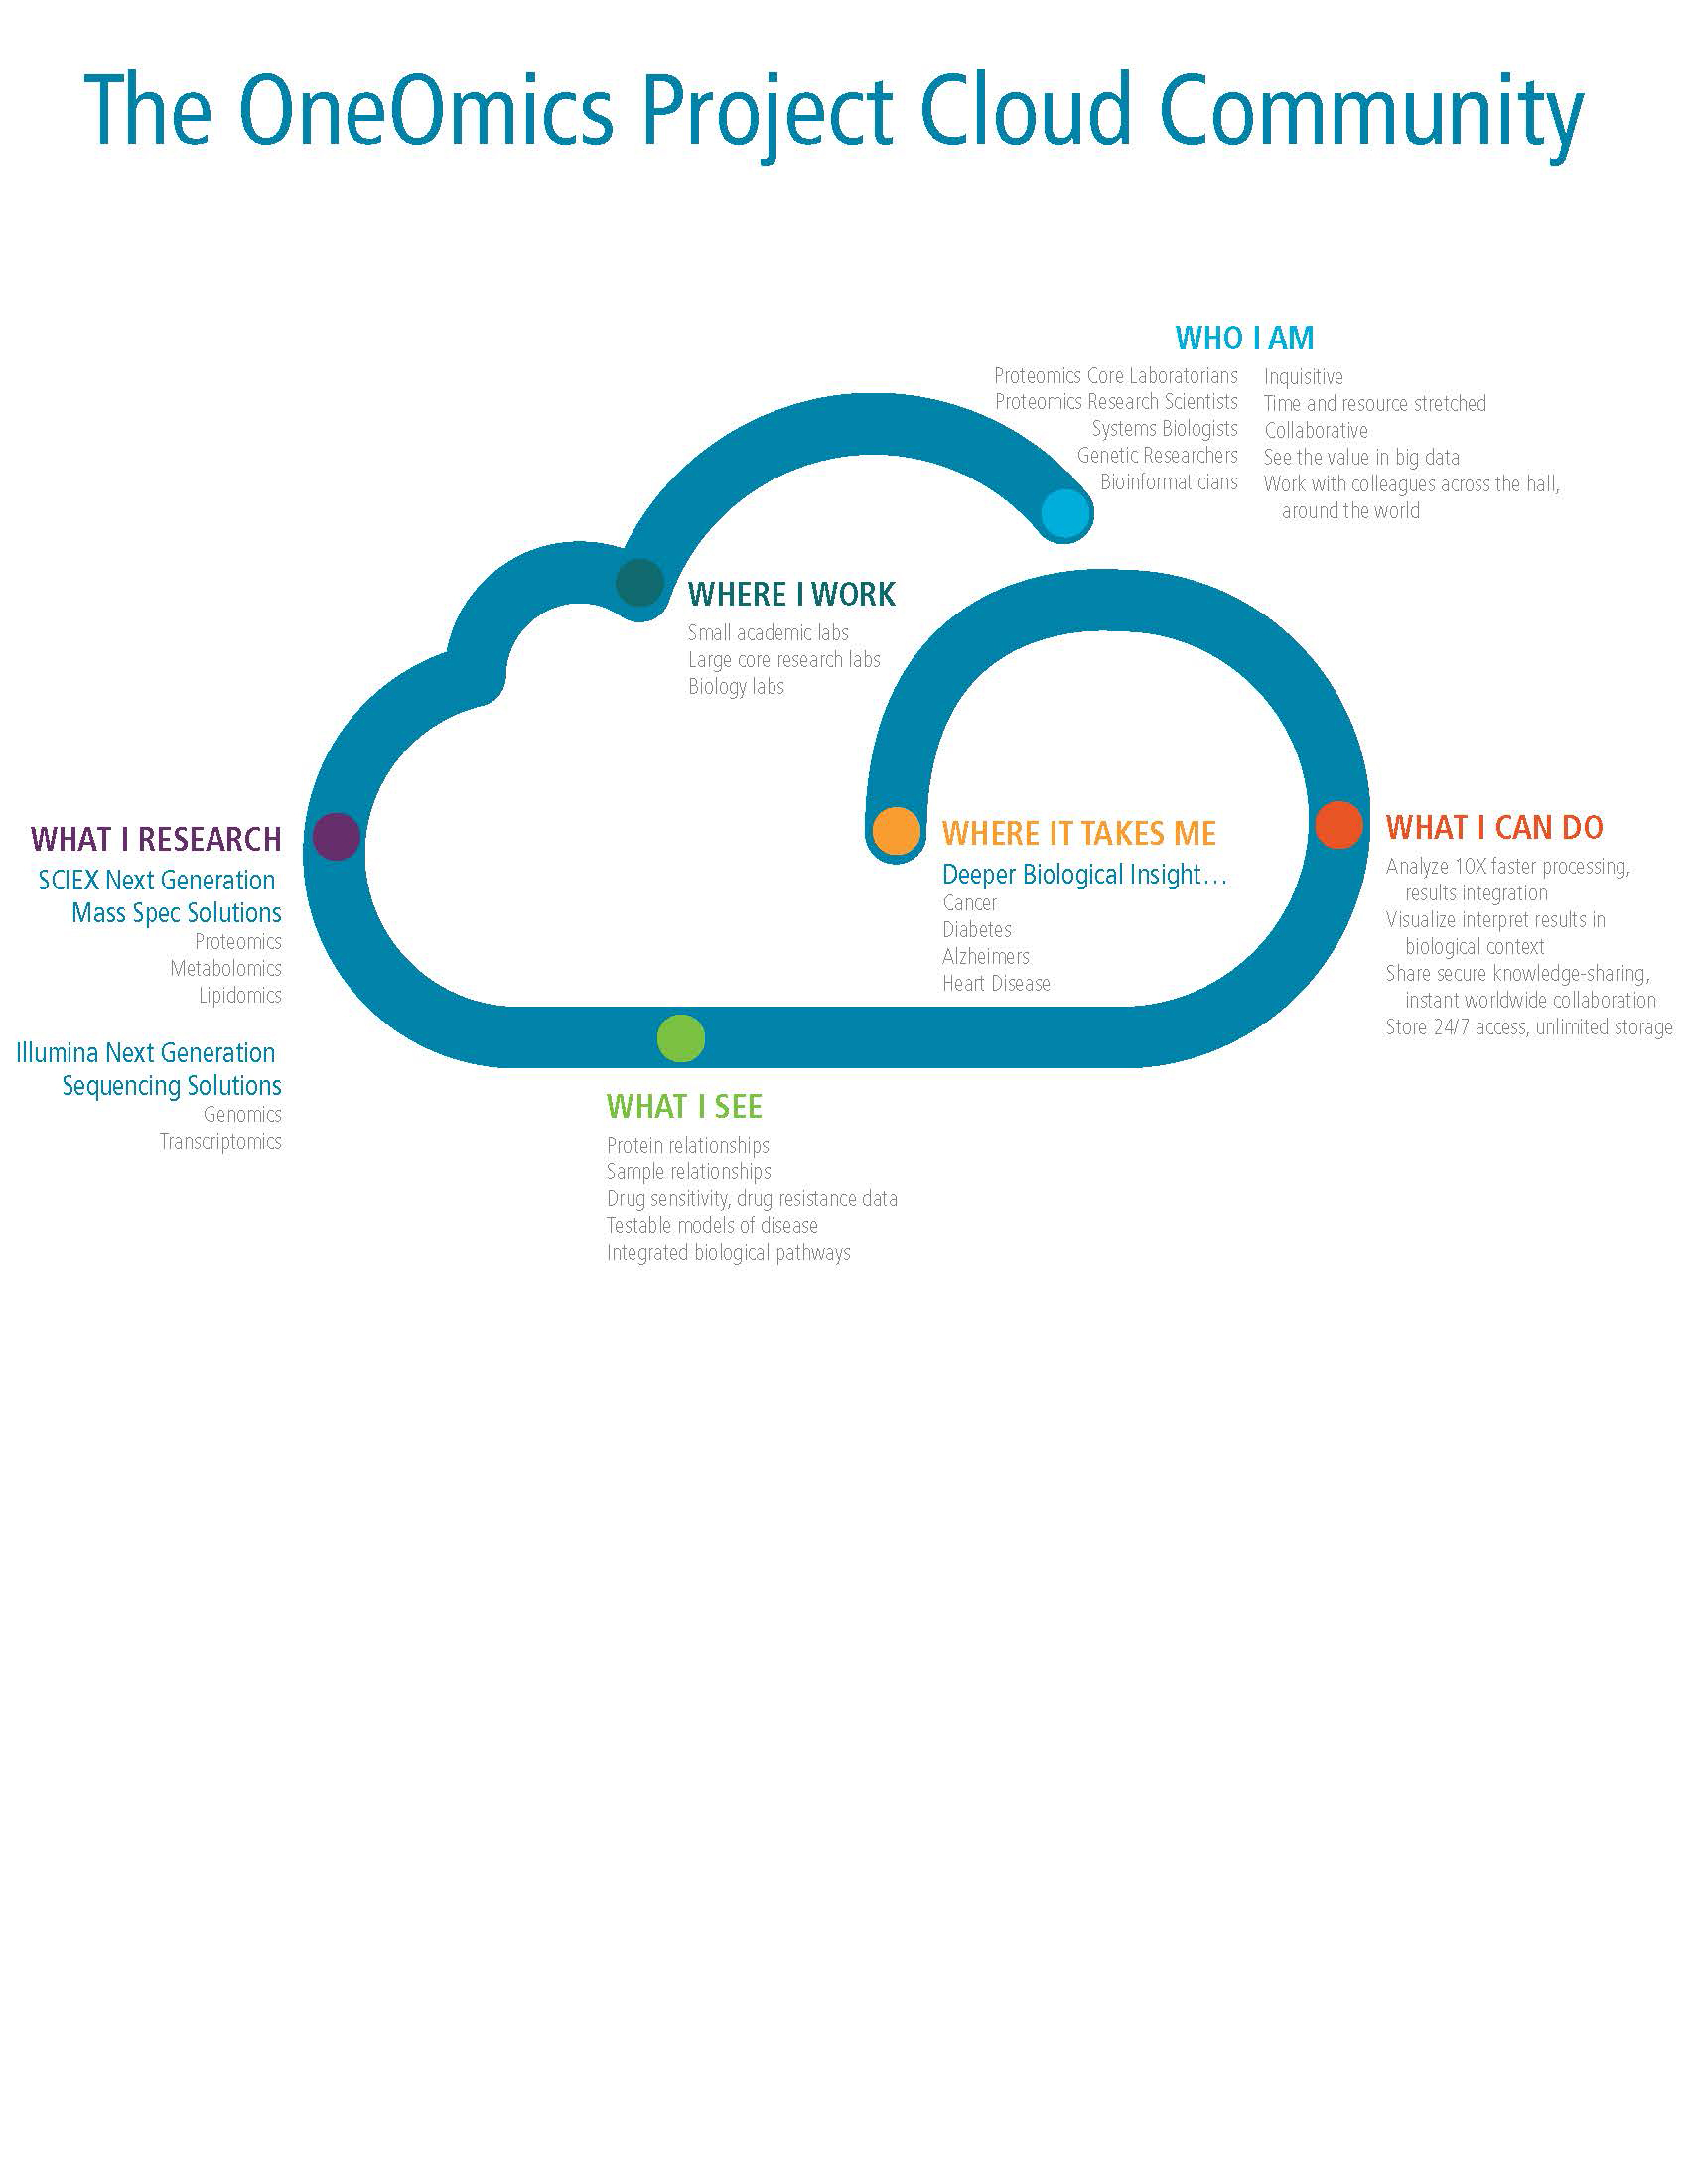
This is the graphic that I received from the client, along with a similarly dense PowerPoint file.
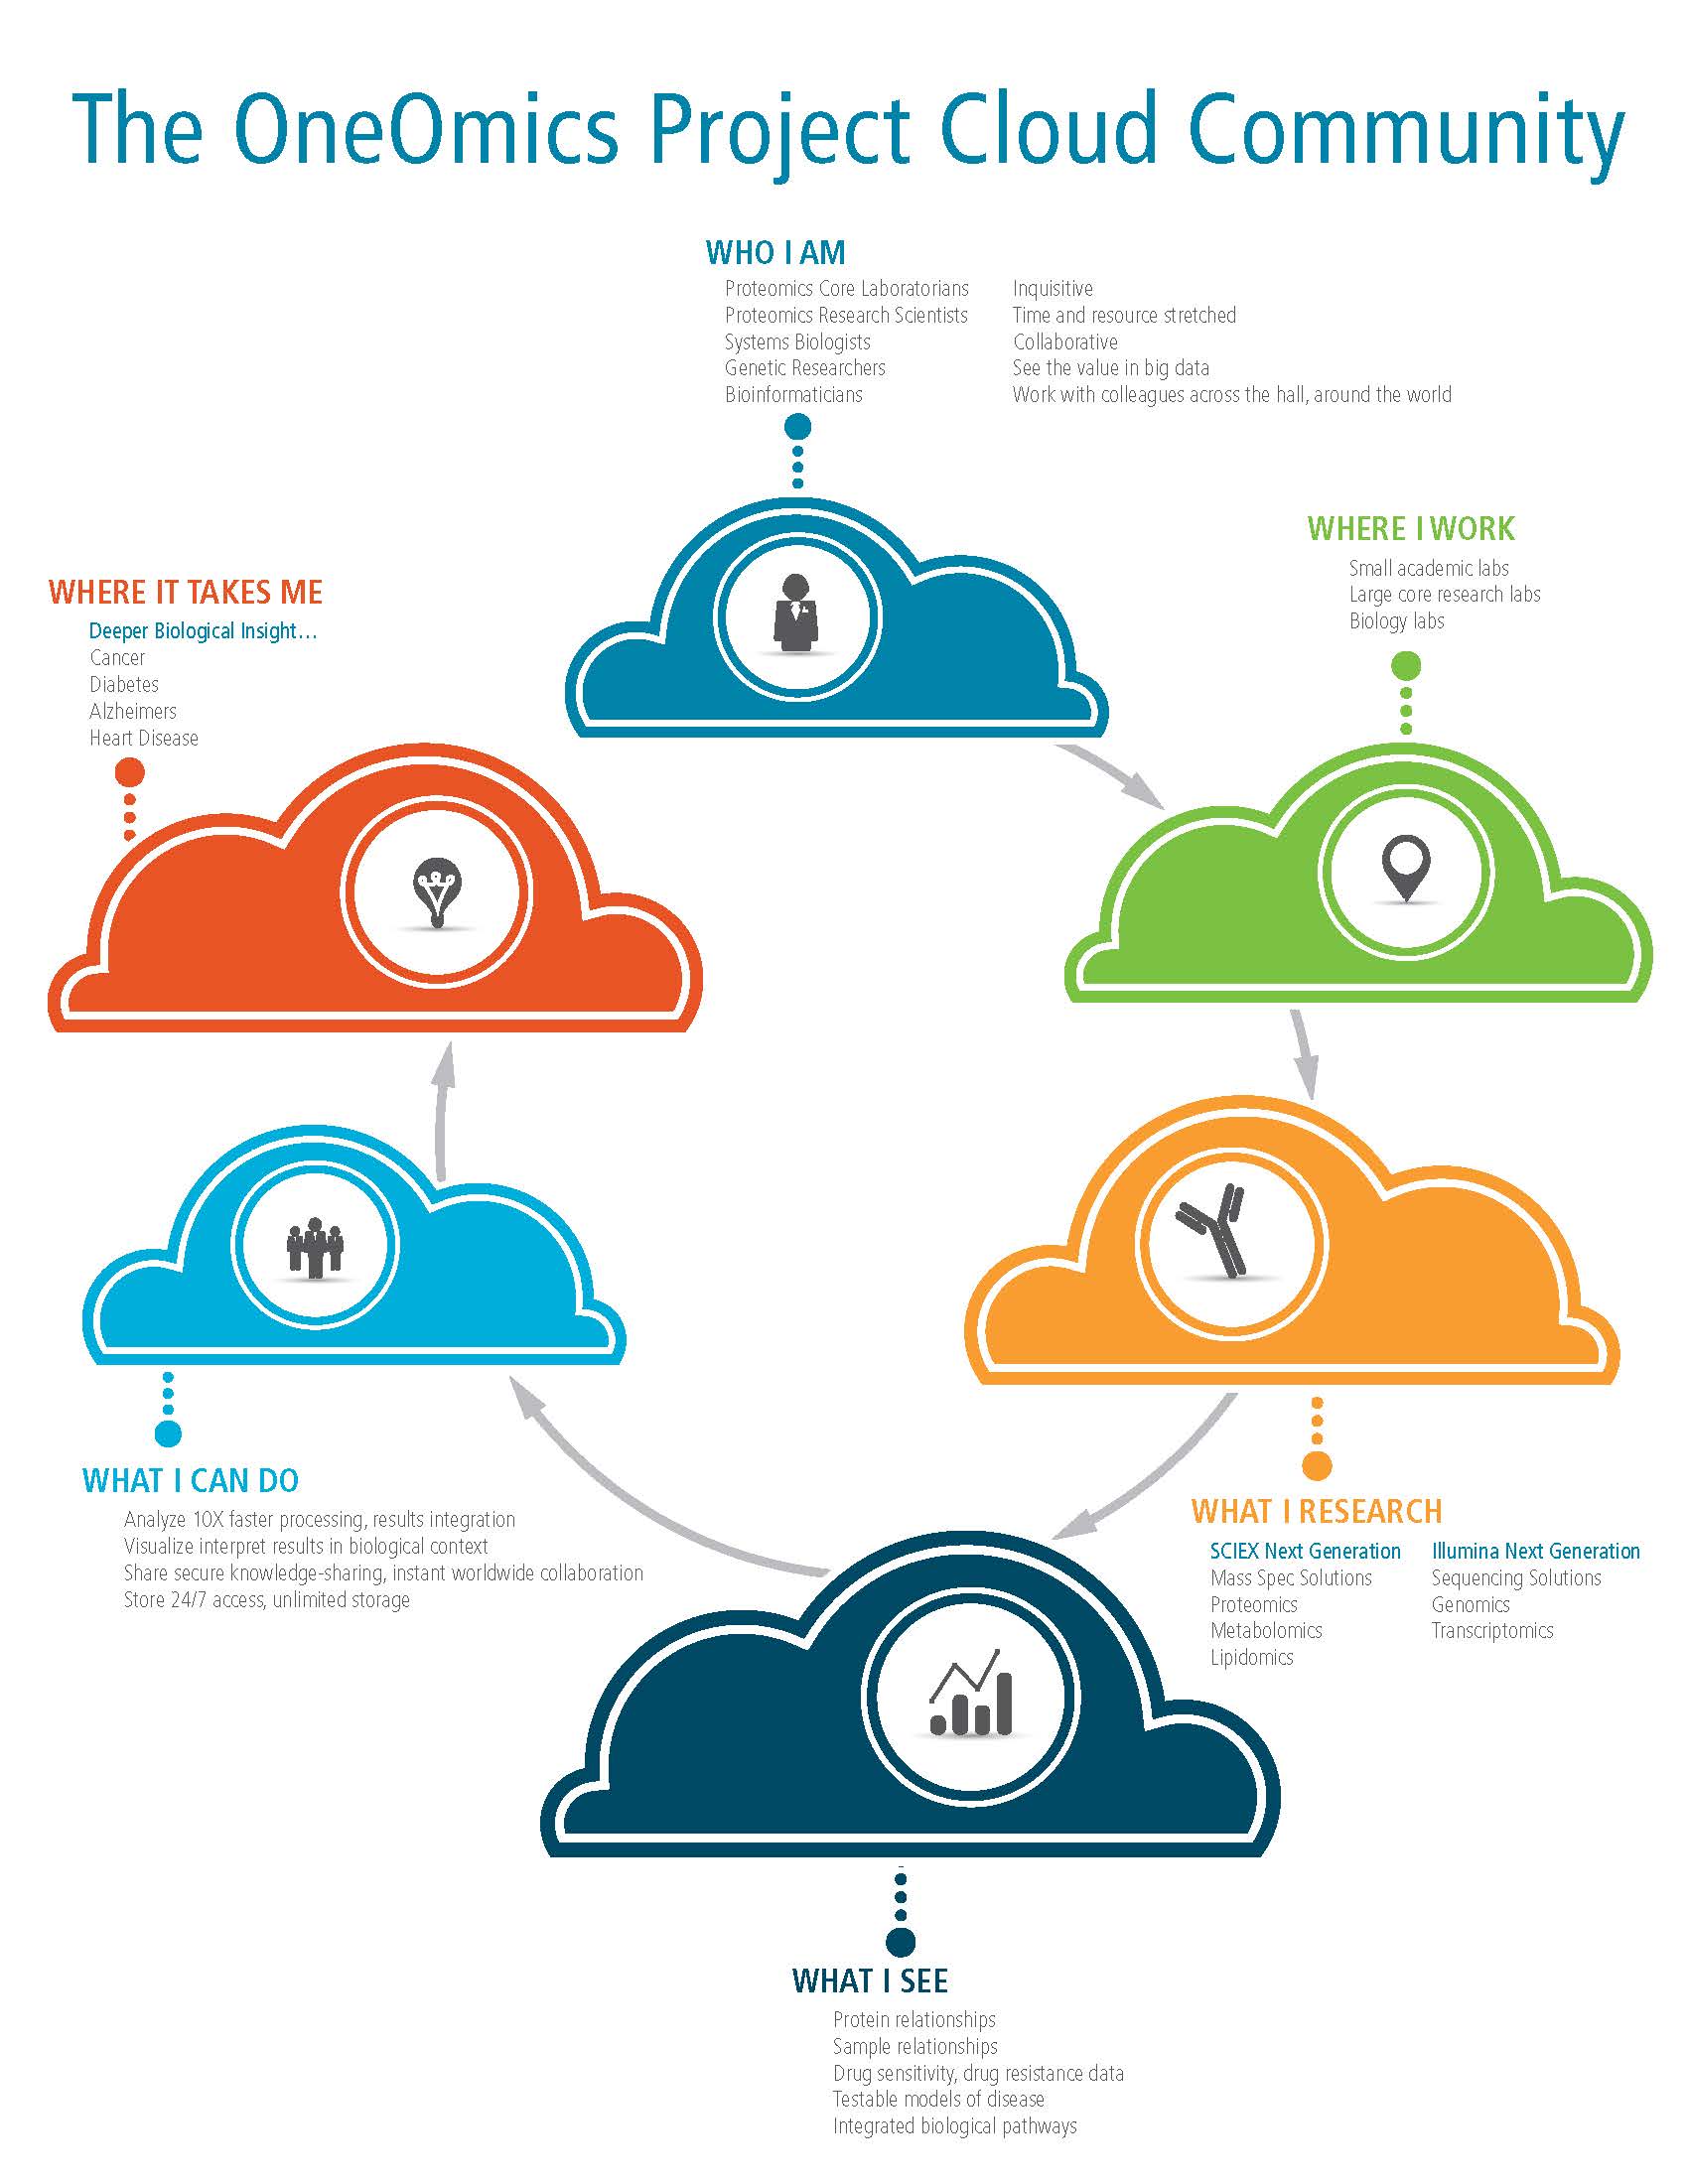
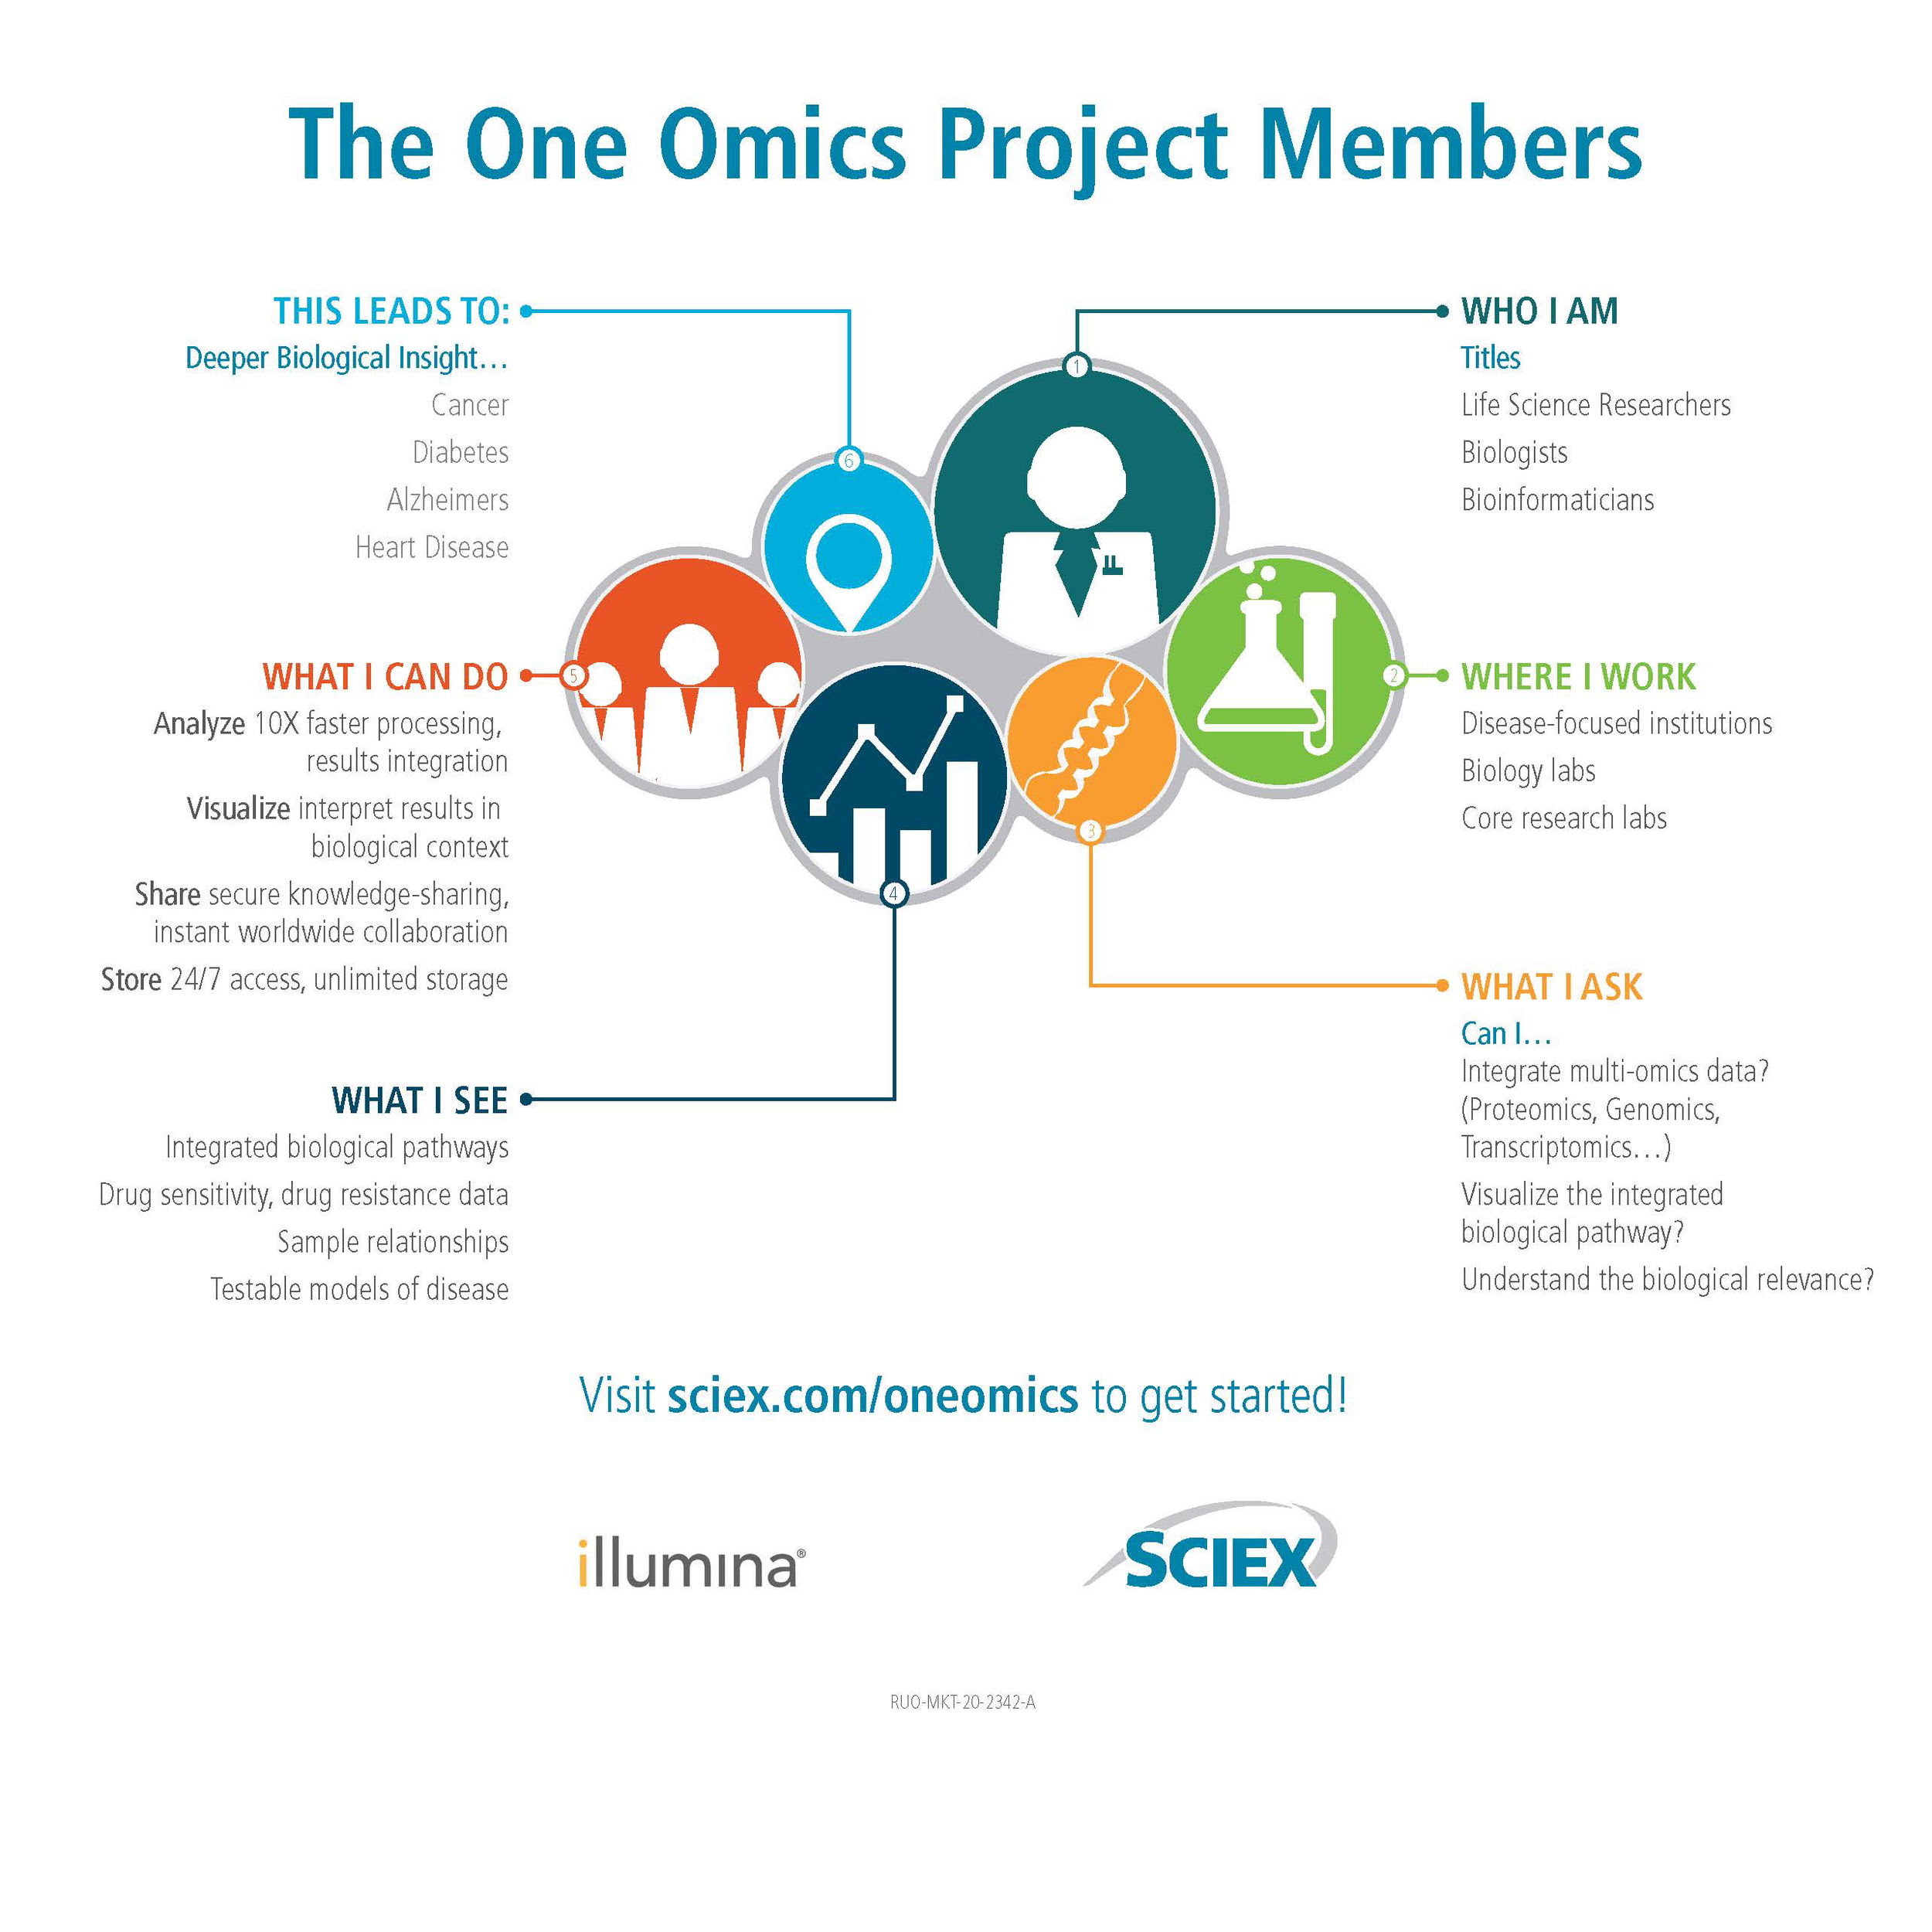
Because this is a cloud-based software that connects scientists to labs worldwide, using a cloud in the graphic was a logical conclusion. After I received the request, and the content that the infographic was based off of, I began with sketches. I thought about how to simplify each step of the infographic.
From this point I moved to the computer to execute my ideas.

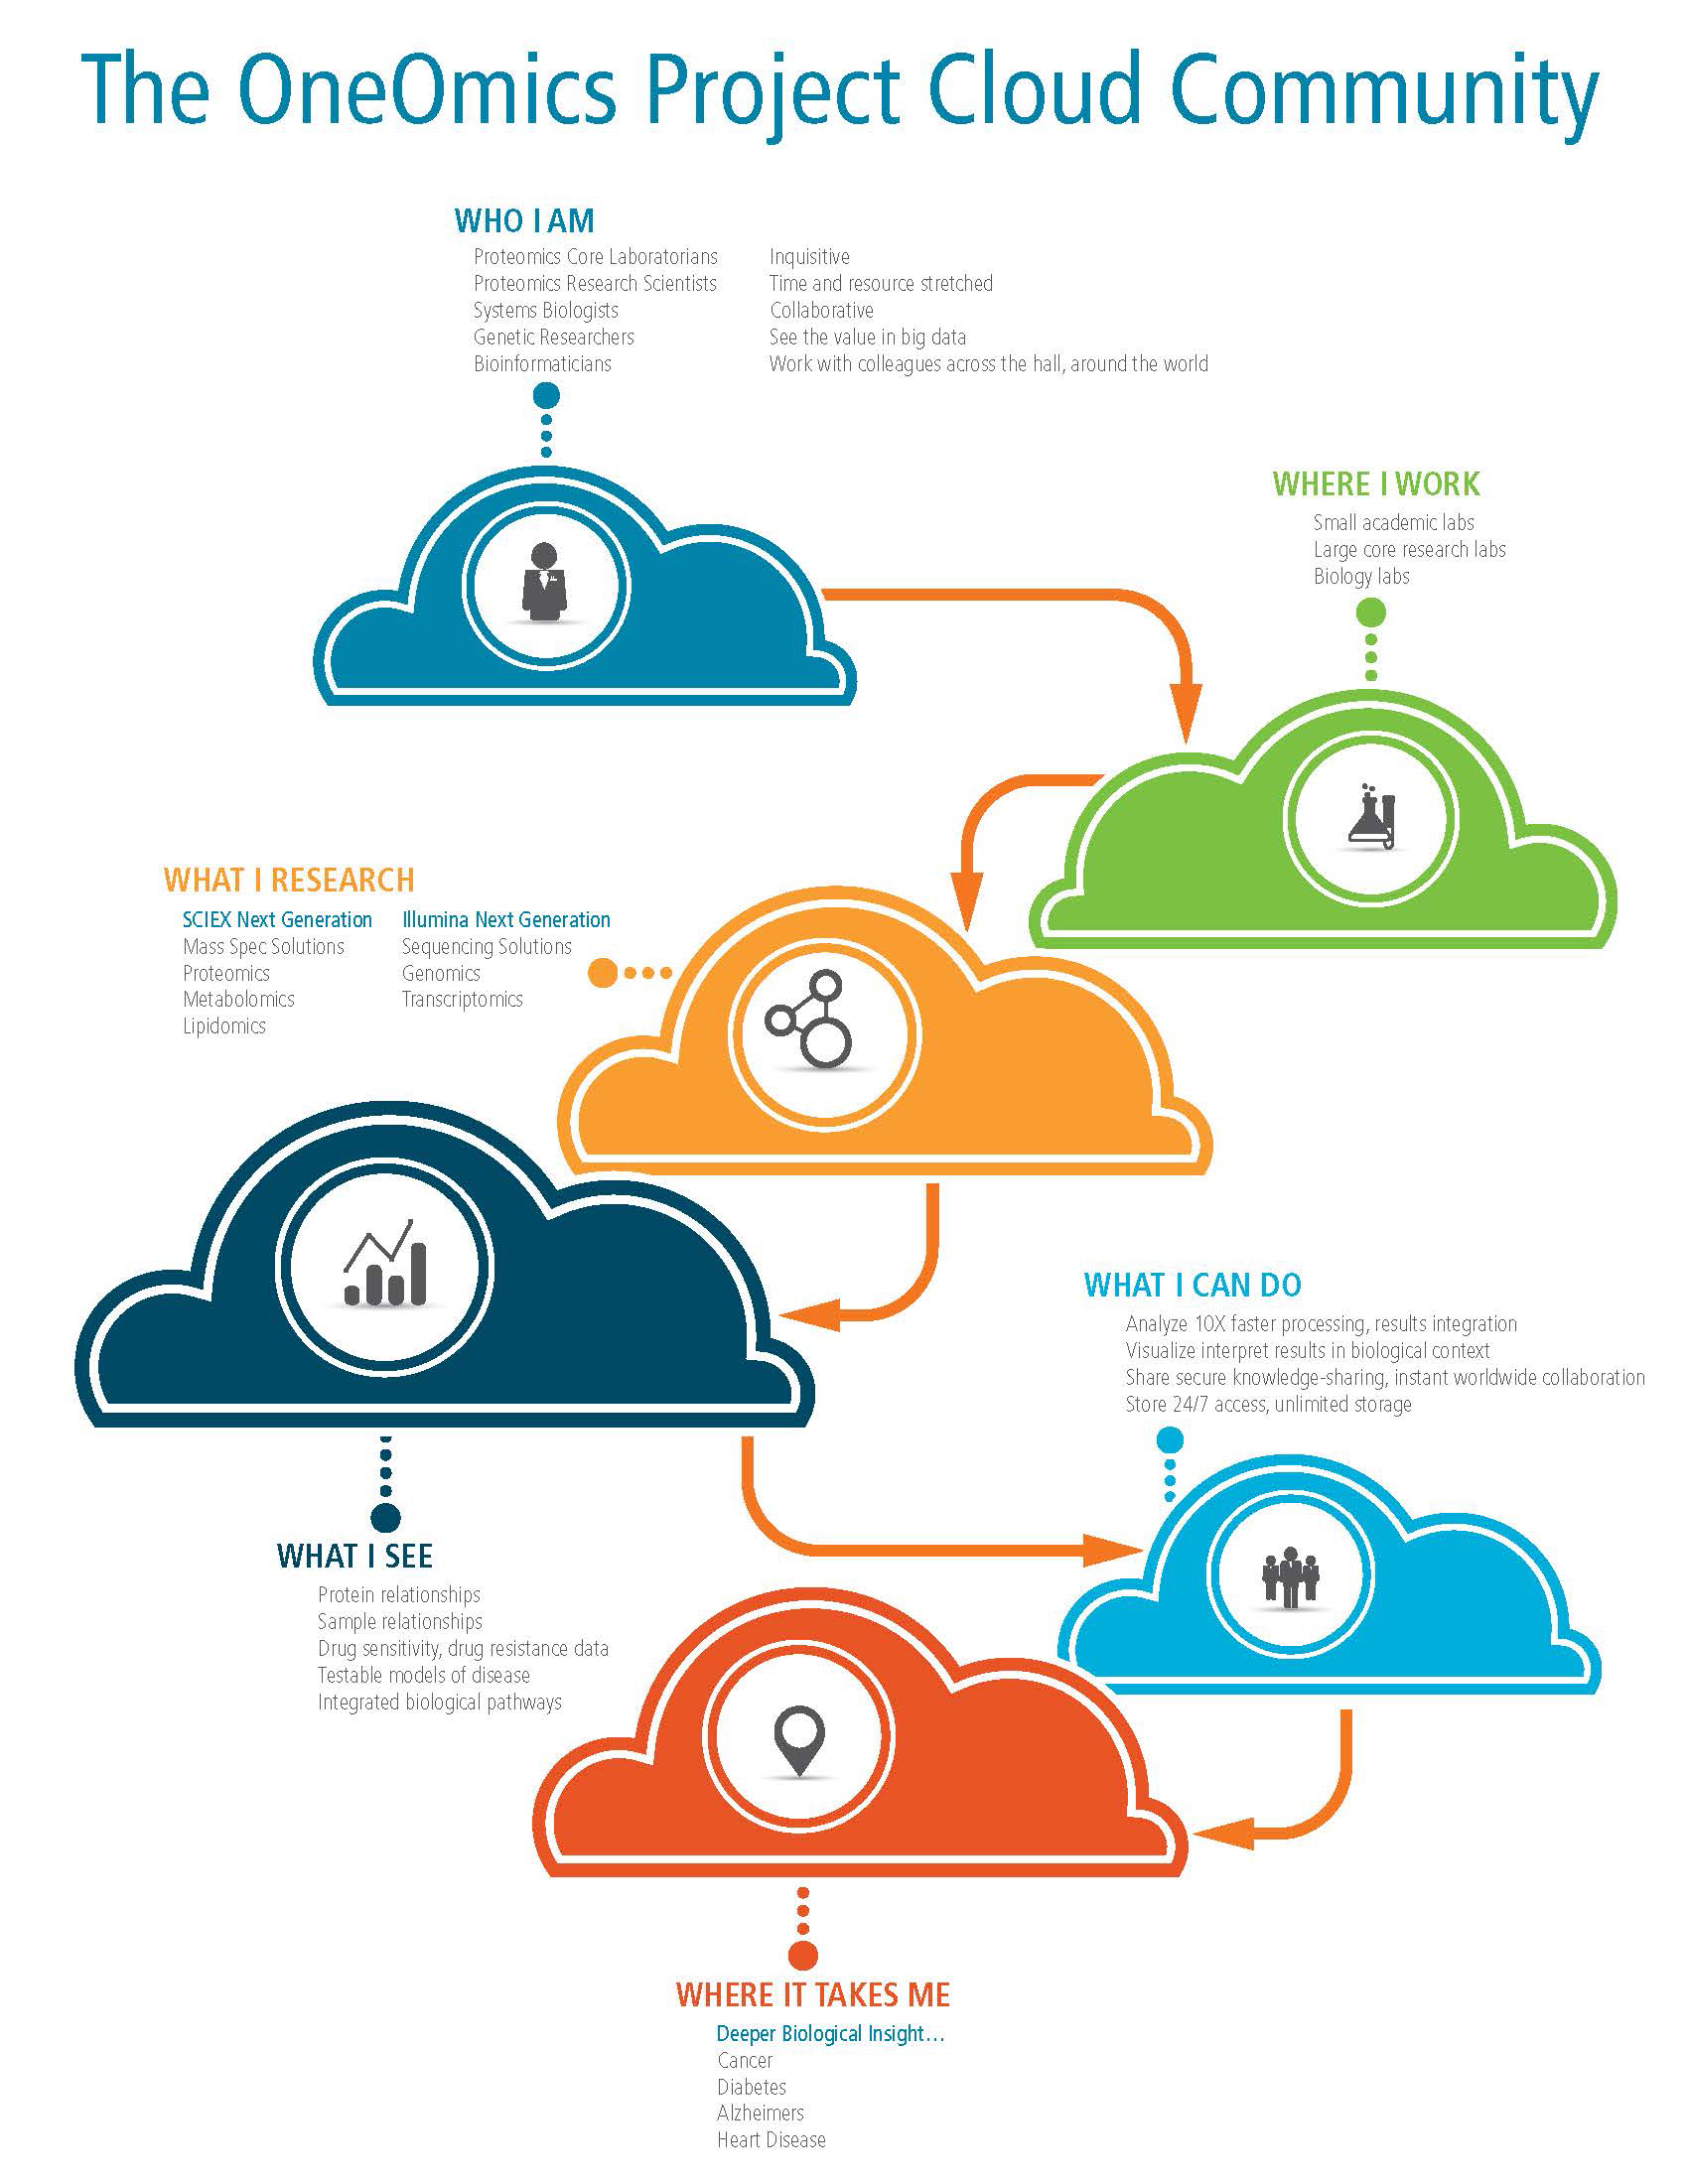

Ann was happy with my designs, and narrowed them down to two to present to her client. She also had some minor modifications to the text.

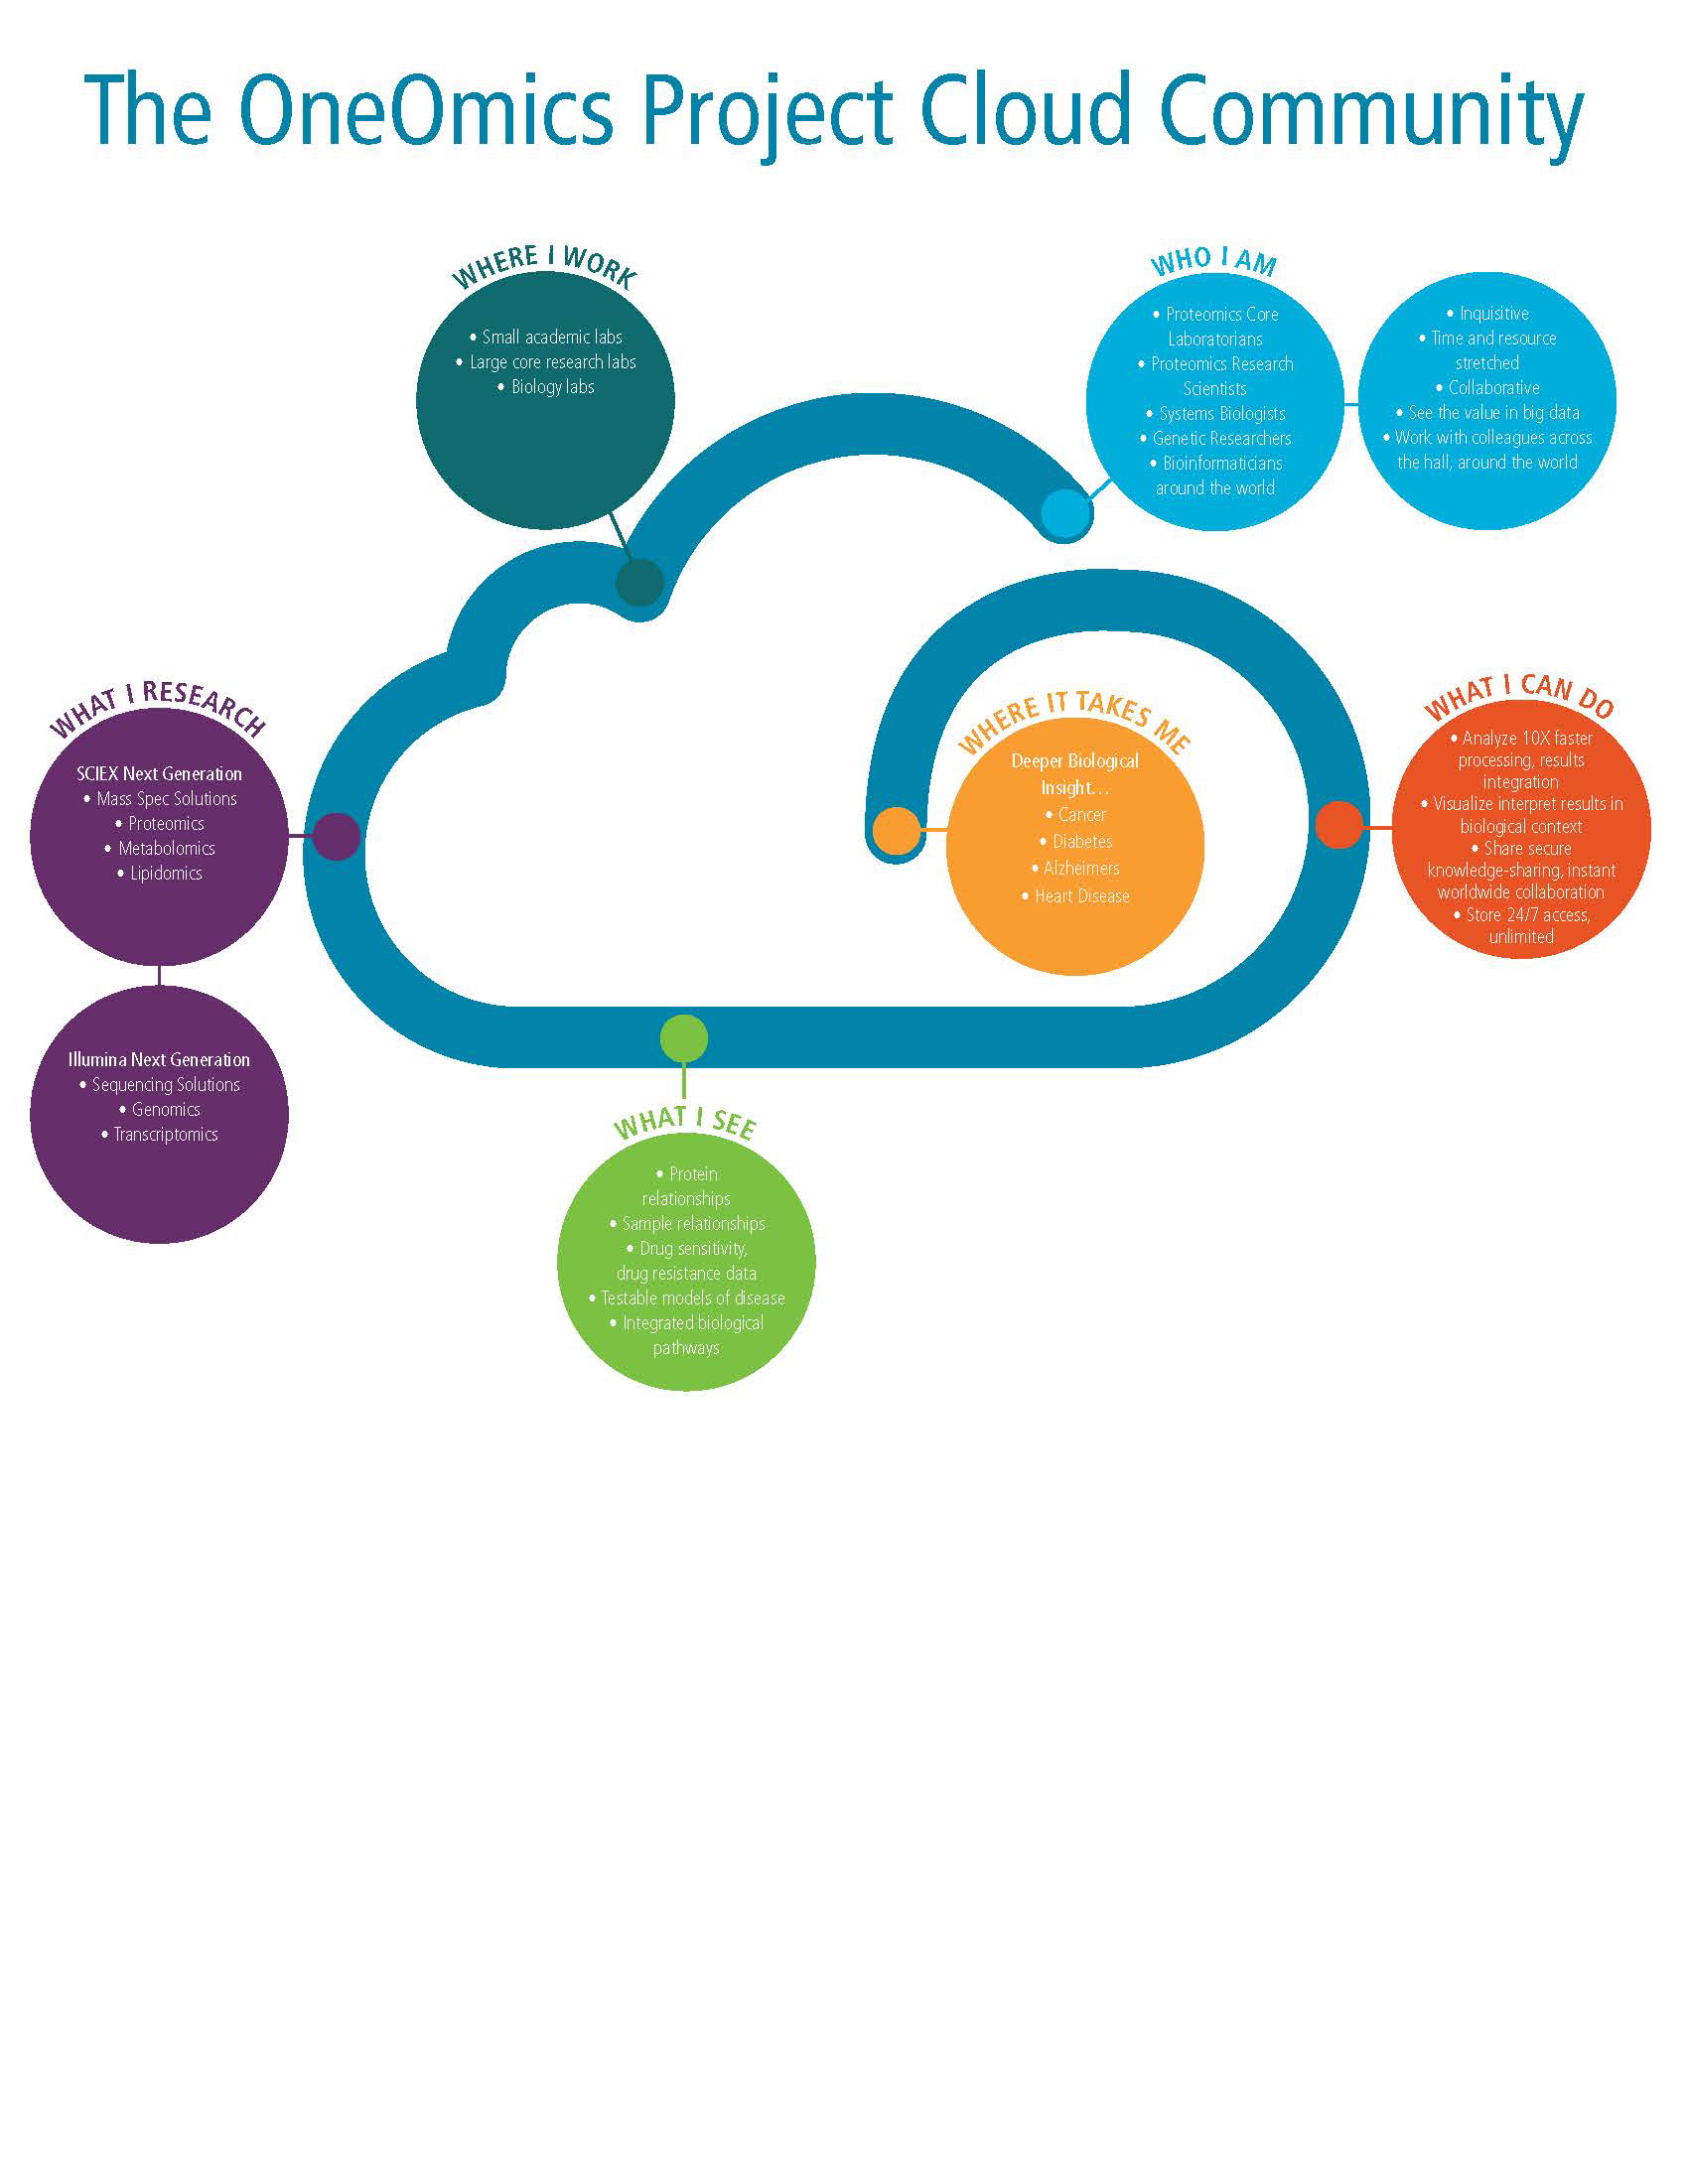
After this round of edits, they decided to take the infographic in-house because the budget was tight for the project.
This is the infographic they went with.